Designing a Metrics Monitoring System like Datadog
In this post, I walk through how I would design a high-throughput metrics monitoring and alerting system.
The system should support:
- ingesting millions of metric events per second
- near real-time alerting
- low-latency dashboard queries
- reliable processing even when data arrives late or out of order
This is definitely not meant to be a perfect design. These are basically my notes on how I would reason through it right now.
What I Want the System to Do
- collect metrics from hundreds of thousands of machines
- store recent high-fidelity data
- support long-range dashboard queries
- trigger alerts quickly when something goes wrong
- keep working during partial failures
What Matters Most
- high throughput
- low query latency
- fast alert evaluation
- high availability
- graceful handling of out-of-order events
The tricky thing about metrics systems is that they have to do three jobs at once:
- absorb a huge write volume
- serve interactive read queries
- evaluate alerts fast enough to be operationally useful
That combination is what makes the design interesting.
Initial Thought (and why it breaks)
My first instinct was:
agents send metrics directly to a database, dashboards read from that database, and alerts poll it
However, that works only up to a point.
The problems show up pretty quickly:
- direct database writes become a bottleneck at high ingest volume
- dashboards and writes start competing for the same storage resources
- polling alerts add latency
- retries and late-arriving events become harder to reason about
- raw data gets too expensive to query over long time ranges
So the design naturally splits for me into a few layers:
- ingestion
- streaming / buffering
- storage
- querying
- alert evaluation
That separation is what makes the system easier to scale.
Core Entities
- Metric: for example
cpu_usage - Label: metadata such as host, region, service, tenant
- Series: a unique combination of metric name + labels
- Alert Rule: a condition evaluated over a moving time window
The key idea is that a time-series system does not just store “CPU values.”
It stores values for many distinct series, and a series is really defined by metric plus labels.
That is powerful, but it is also where cardinality problems come from.
High-Level Architecture
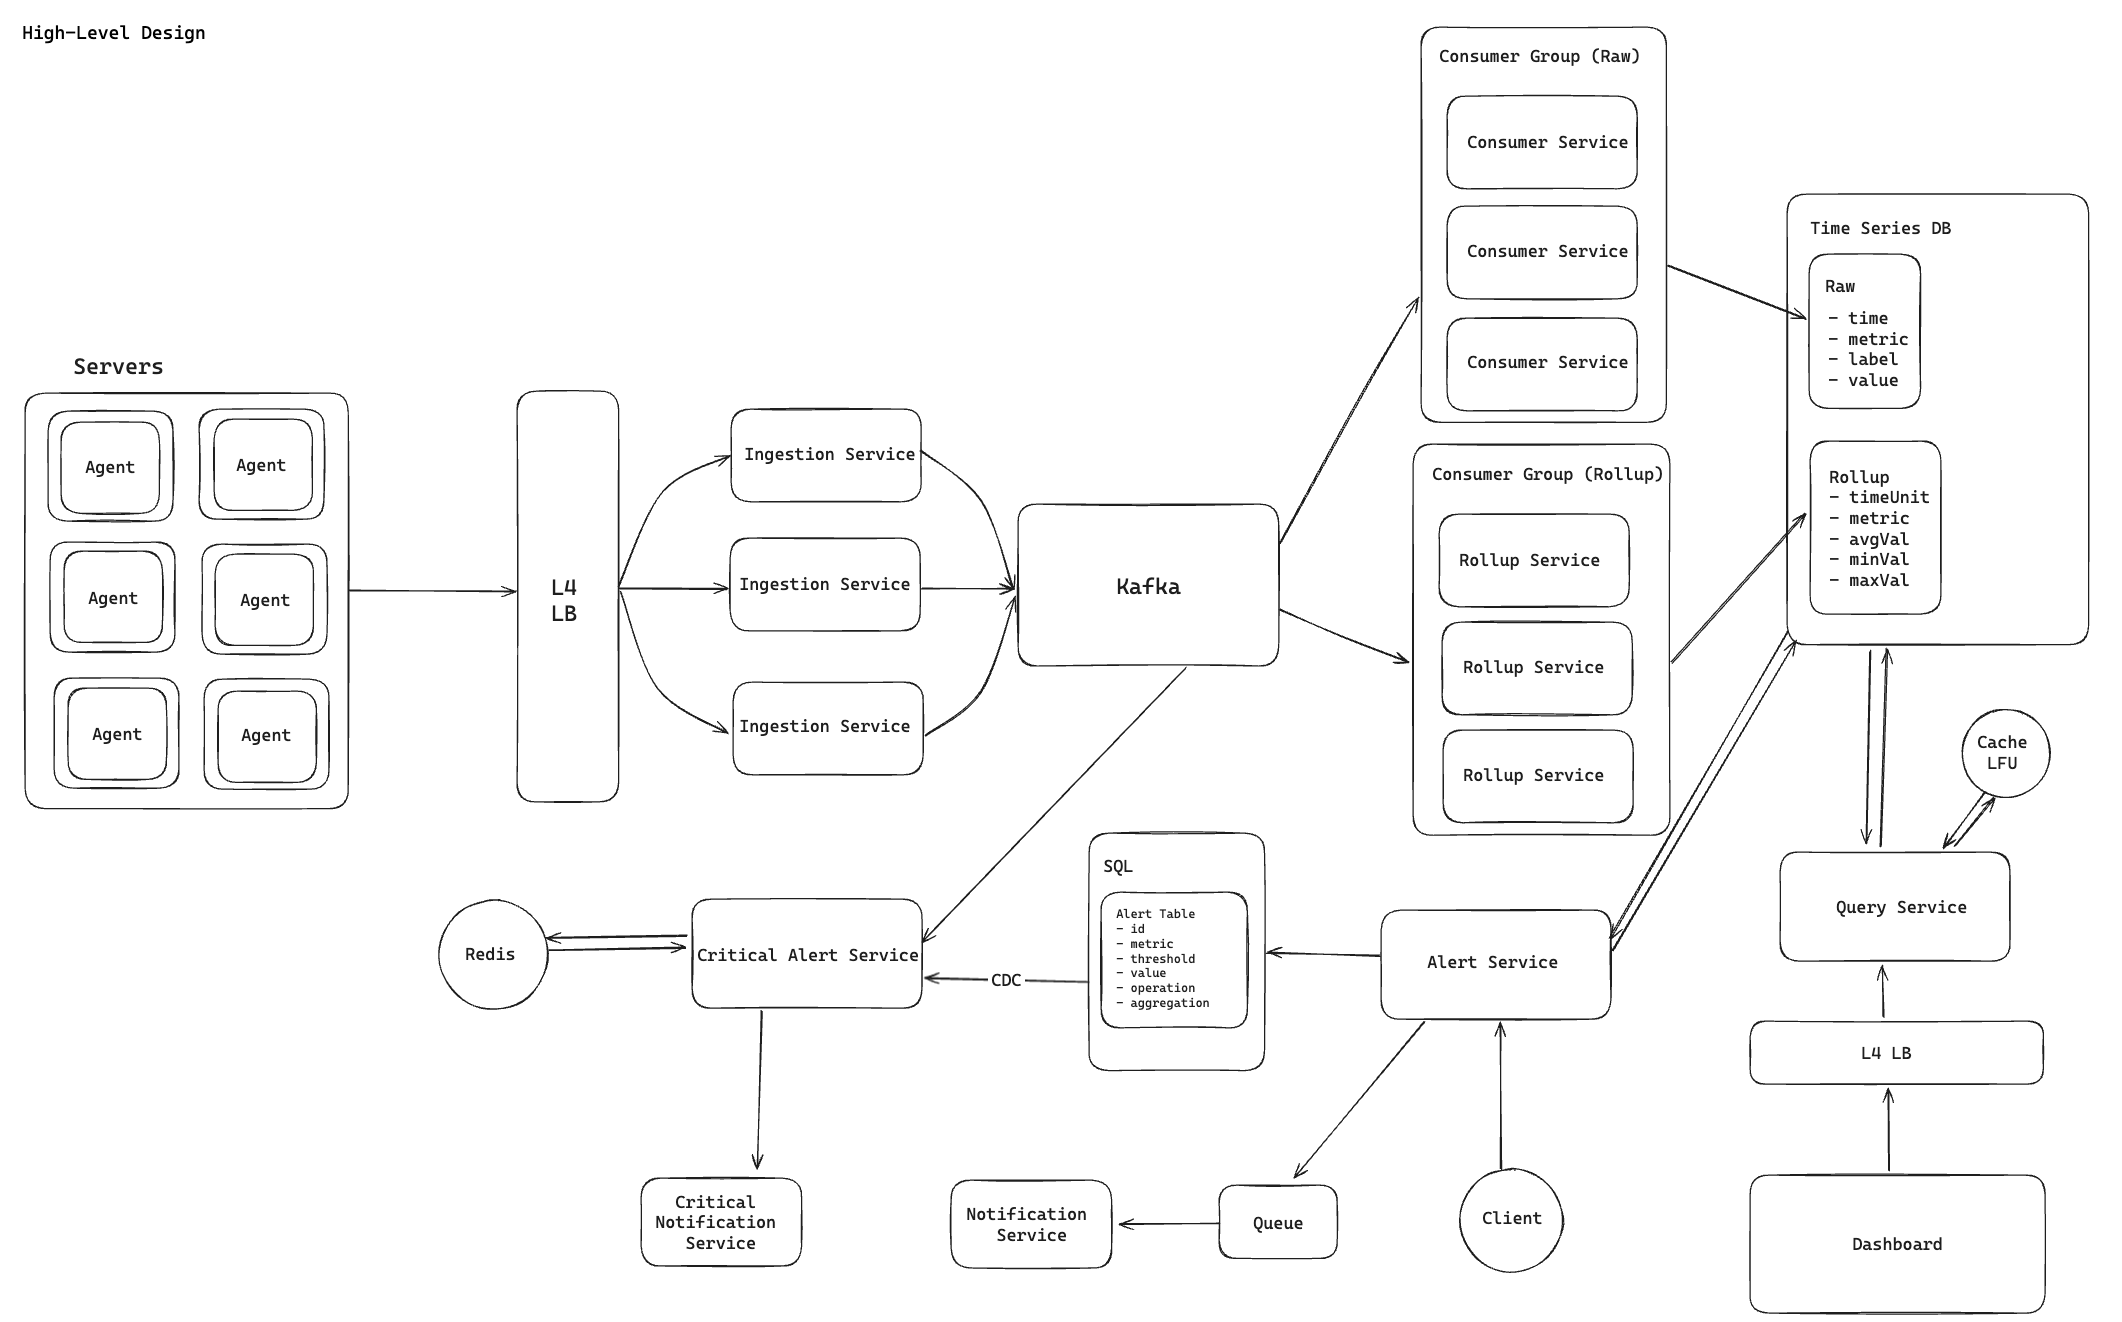
The main layers I would use are:
- agent layer on each server
- stateless ingestion service
- Kafka as the streaming backbone
- raw and rollup consumer pipelines
- time-series storage
- query service for dashboards
- alerting services for polling and streaming use cases
The basic flow looks like:
- agents batch and send metric events
- ingestion nodes validate and publish to Kafka
- raw consumers write detailed samples to storage
- rollup consumers precompute aggregates
- query service reads from raw or rollup data depending on time range
- alerting services evaluate conditions and trigger notifications
Ingestion Layer
Each machine runs a lightweight agent that batches metrics before sending them upstream.
Requests go through an L4 load balancer to a fleet of stateless ingestion service instances.
Why I like that setup:
- stateless ingestion is easy to scale horizontally
- agents can buffer temporarily during failures
- batching reduces per-request overhead
- the ingestion tier stays simple and focused on validation plus handoff
I would also make the ingestion API idempotent enough to tolerate retries, because metric senders will absolutely retry during network issues.
Streaming Layer
The ingestion service publishes incoming metrics into Kafka.
Kafka is doing a lot of work for this design:
- absorbing bursty writes
- decoupling ingestion from downstream consumers
- enabling independent consumer groups
- providing durable replay after failures
Partitioning matters a lot here.
I would partition by something stable such as:
- tenant ID
- service or host grouping
- some hash of the series key
The goal is to spread load while preserving enough locality for downstream processing.
This is one place where hot partitions can become a real problem if a small set of tenants or hosts sends much more traffic than everything else.
Consumer Layer
I would split processing into two independent pipelines.
Raw Consumer Group
- consumes from Kafka
- writes raw samples into time-series storage
- keeps recent, high-fidelity data available
This path is important for:
- recent dashboards
- debugging incidents
- root-cause analysis
Rollup Consumer Group
- consumes the same Kafka stream
- computes time-bucketed aggregates
- writes summarized data into rollup tables
Typical aggregates:
- average
- minimum
- maximum
- count
- percentiles if needed
This is one of the most useful design splits in the system.
Raw data gives flexibility, but rollups make longer-range queries much cheaper.
Storage Layer
I would use a time-series-oriented database such as TimescaleDB, ClickHouse, or InfluxDB depending on the surrounding stack and query needs.
Raw Data Store
Stores fields like:
- timestamp
- metric name
- labels
- value
Used for:
- recent queries
- detailed debugging
- short retention high-fidelity access
Rollup Store
Stores fields like:
- time bucket
- metric name
- label dimensions or preselected grouping keys
- aggregate values
Used for:
- long-range dashboard queries
- lower-cost historical analysis
- faster aggregate reads
I would also think about retention tiers here.
For example:
- raw data kept for a short window
- rollups kept much longer
That usually gives a better cost/performance balance than keeping everything raw forever.
Query Layer
Dashboards should hit a dedicated Query Service instead of reading storage directly.
That service would:
- validate and parse queries
- enforce tenant isolation
- choose raw versus rollup tables based on time range and granularity
- optionally merge recent raw data with older rollup data
- use caching for repeated dashboard requests
The important idea is that query routing should be intentional.
If every dashboard query hits the raw table, the system gets expensive fast.
So my mental model is:
- recent and detailed queries -> raw data
- long-range and aggregate queries -> rollups
That is the main compute versus storage tradeoff in the design.
Alerting System
I would split alerts into two categories because not every alert needs the same latency.
Standard Alerts
For less latency-sensitive alerts:
- alert service periodically queries the time-series store
- matching conditions generate alert events
- notification service delivers email, SMS, or push notifications
This polling model is simpler and often good enough for many use cases.
Critical Alerts
For latency-sensitive alerts, I would move evaluation onto the streaming path.
- a critical alert service consumes metrics directly from Kafka
- alert rules are stored durably in SQL
- rules are propagated to evaluators, for example through CDC
- active rule state is kept in memory for fast evaluation
The flow becomes:
- metric arrives in Kafka
- alert evaluator checks active rules immediately
- if a threshold is breached, notification is triggered
That avoids the lag introduced by polling.
It is more complex, but much more aligned with operationally urgent alerting.
Write Path
A typical write flow in my head looks like this:
- agent batches and sends metric samples
- ingestion service validates format, tenant metadata, and basic limits
- ingestion service publishes events to Kafka
- raw consumers write detailed samples to storage
- rollup consumers update aggregate tables
- streaming alert consumers evaluate critical rules
That keeps the hot write path append-heavy and avoids forcing every responsibility onto the database.
Read Path
A typical dashboard query would look like:
- dashboard sends a query to the Query Service
- service authenticates and validates the request
- service decides whether the query should read raw data, rollup data, or both
- results are returned with optional caching
I like this separation because it gives the system a place to encode query policy instead of leaving every client to guess which table it should use.
Deep Dives
Scaling to Millions of Metrics per Second
The rough scaling story is:
- horizontally scale ingestion services
- use Kafka partitions for parallel consumption
- scale raw and rollup consumers independently
- batch aggressively at the agent and consumer layers
That gives the system multiple places to absorb throughput instead of pushing all pressure onto storage.
Low-Latency Queries
Querying raw samples over long time ranges is expensive.
The main fix is precomputation:
- store raw data for detail
- store rollups for efficiency
- route queries intentionally
Without that split, the dashboard experience usually degrades first.
Real-Time Alerts
Polling is simpler, but it adds latency that can matter during incidents.
So for high-priority alerts, I would rather evaluate directly from the stream and keep only the state needed for sliding-window checks in memory or fast state storage.
Out-of-Order Events
Metrics often arrive late because of retries, batching, or temporary network failures.
That means the system needs a clear rule for how long it will accept late data into a window or rollup.
Typical choices are:
- allow a bounded lateness window
- update aggregates during that window
- close the window after a threshold and treat later data separately
Without this, rollups and alerts can become inconsistent.
Cardinality Explosion
This is one of the biggest practical risks in a metrics platform.
If users attach highly variable labels such as request IDs or user IDs, the number of distinct series can explode.
That hurts:
- storage footprint
- memory usage
- query latency
- indexing efficiency
So I would want safeguards such as:
- label allowlists or validation
- per-tenant cardinality limits
- visibility into top cardinality offenders
Failure Recovery
For the critical alert path, recovery would look something like:
- reload alert rules from durable storage
- restore recent evaluation state if needed
- resume Kafka consumption from committed offsets
Kafka offsets matter a lot here because they define where each consumer group continues after a crash.
That helps prevent data loss and limits duplicate processing.
More broadly, I would want resilience at each layer:
- agents buffer and retry temporarily
- ingestion nodes are stateless and replaceable
- Kafka replicates across brokers
- consumers can replay from offsets
- notifications are queued for reliable delivery
Tradeoffs
Kafka vs Simpler Queues
Kafka is more operationally complex, but I think it is the better fit here because:
- throughput is much higher
- replay is valuable
- multiple consumer groups are a first-class pattern
A simpler queue is easier to operate, but not as natural for a multi-consumer streaming pipeline.
Raw vs Rollup Storage
Raw data gives fidelity and flexibility.
Rollups give much faster and cheaper long-range queries.
You usually need both.
Streaming vs Polling Alerts
Polling is easier to build.
Streaming is better for low-latency alerting.
I would not use streaming for everything, but I also would not rely on polling for urgent incident signals.
More Labels vs More Cost
Rich labels make the system more useful, but they also increase cardinality and cost.
That tradeoff is easy to ignore early and painful later.
What I’d Worry About Most
If I were talking through this in an interview, the areas I would watch most carefully are:
- hot Kafka partitions
- very high-cardinality label dimensions
- dashboard queries that accidentally hit raw data for huge ranges
- alert storms during incidents
- late or duplicate metric samples
Those are the kinds of problems that usually decide whether the system stays healthy under real production load.
Final Thoughts
The shape of the design that makes the most sense to me is:
- Kafka as the write buffer and streaming backbone
- separate raw and rollup pipelines
- a query service that chooses the right storage path
- polling for standard alerts and streaming for critical ones
That gives the system a good balance of throughput, query performance, and alert latency without asking one component to do everything.
If I wanted to push this design further, I would probably go deeper into:
- retention policies
- compression
- multi-region replication
- percentile rollups
- tenant isolation and noisy-neighbor controls